Simulation Details
In this section, we dive into the mechanics of how the Race Simulation App works. By simulating race conditions, driver performance, and strategic decisions, the app generates realistic race outcomes that can be analyzed to predict potential results.
How the Simulation Works
The race simulation process is designed to replicate the complexities of a real race, taking into account various factors that influence the outcome. Here’s a breakdown of the key components:
1. Driver Attributes
Each driver is assigned ratings based on four attributes: Pace, Racecraft, Awareness, and Experience. These ratings play a crucial role in determining how well a driver performs during different phases of the race. For example:
- Pace: Determines the raw speed of the driver, influencing their lap times.
- Racecraft: Affects the driver’s ability to overtake or defend positions during the race.
- Awareness: Reflects the driver’s ability to avoid mistakes and collisions.
- Experience: Impacts strategic decisions, particularly during high-pressure moments.
2. Race Strategies
Before the simulation starts, each driver is assigned a race strategy, which dictates the order and type of tire compounds used during the race. The strategies are carefully chosen to balance speed and durability, and they include options such as:
- Speed then Endurance: Starting with soft tires for speed, switching to hard tires for endurance.
- Balanced to Longevity: Using medium tires initially, followed by a combination of soft and hard tires to optimize performance over the race distance.
- One Stopper: A conservative strategy with minimal pit stops to maintain consistent performance.
3. Lap-by-Lap Simulation
The simulation runs on a lap-by-lap basis, where each lap time for a driver is calculated based on their attributes, tire condition, and random factors like track evolution and minor errors. Key elements include:
- Tire Degradation: As the race progresses, tire wear impacts lap times, with softer compounds degrading faster than harder ones.
- Track Evolution: The track surface improves over time, generally leading to faster lap times as rubber is laid down.
- Random Events: Unpredictable factors such as weather changes or minor mistakes can alter a driver’s performance temporarily.
4. Pit Stops and Strategy Execution
Pit stops are a critical aspect of the race. The timing and execution of pit stops are determined by the chosen strategy and the tire degradation rates. Pit stops are factored into the simulation by adding time penalties during the pit lap, and they can significantly influence the final positions.
5. Generating Results
Once all laps are simulated, the total race time for each driver is calculated. Drivers are then ranked based on their cumulative times to determine the final race positions. The simulation is run multiple times to produce a distribution of possible outcomes, providing a probabilistic view of race results.
Finishing Position Distributions
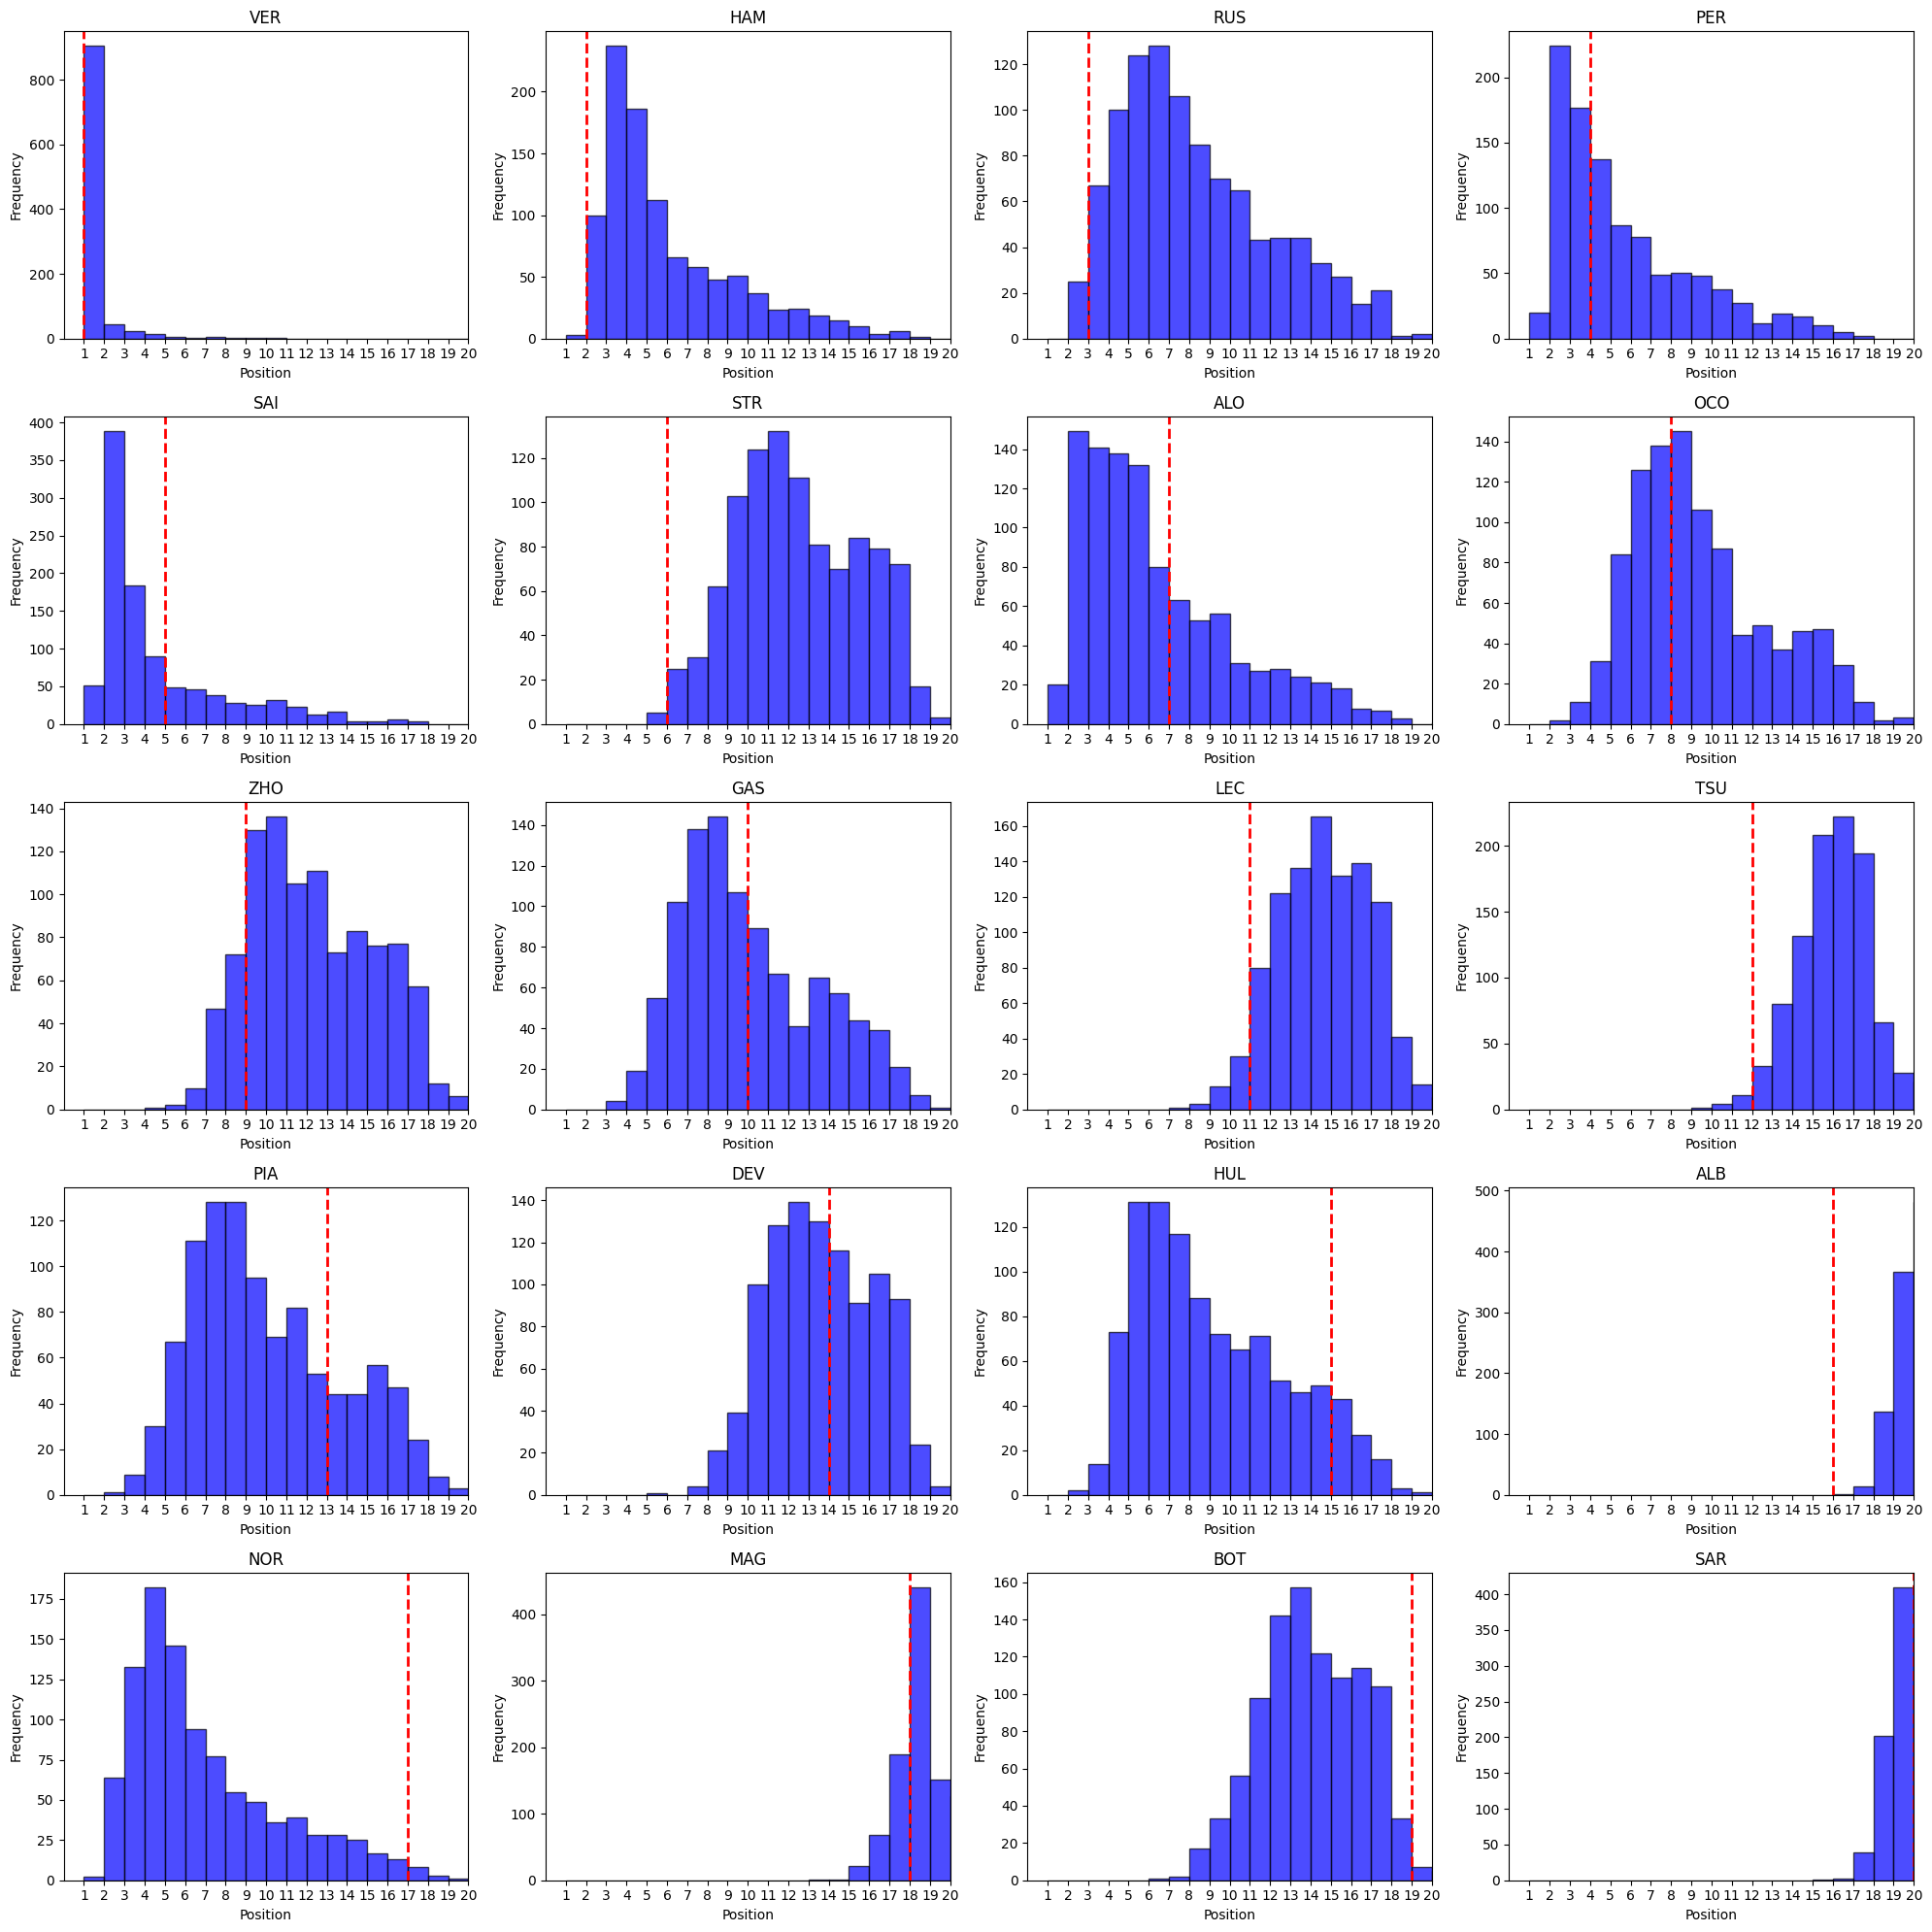
The histogram below illustrates the distribution of finishing positions for each driver after running multiple simulations for the 2023 Spanish Grand Prix. The results show the frequency of each position a driver might finish in, providing insight into their potential performance. The red line indicates the actual finishing position of the driver in the real race, allowing for a direct comparison between simulated and actual outcomes.

Lap Time Analysis
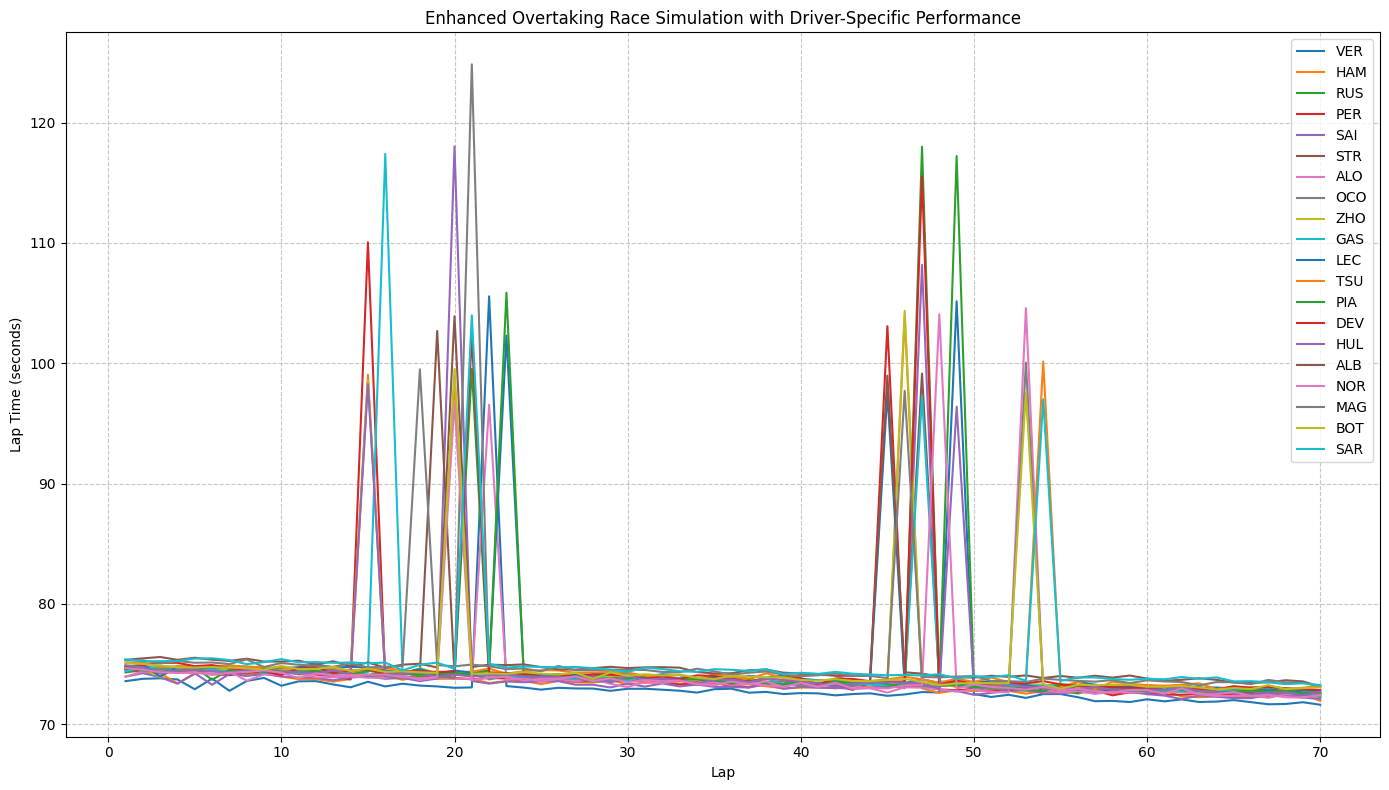
The line graph below represents the lap times for each driver across the race. The spikes indicate pit stops or other significant events that impacted the drivers' lap times. The consistency and variations in lap times reflect both driver skill and strategic decisions.
